CHARTS for Tuesday Tea Time → July 27, 2021
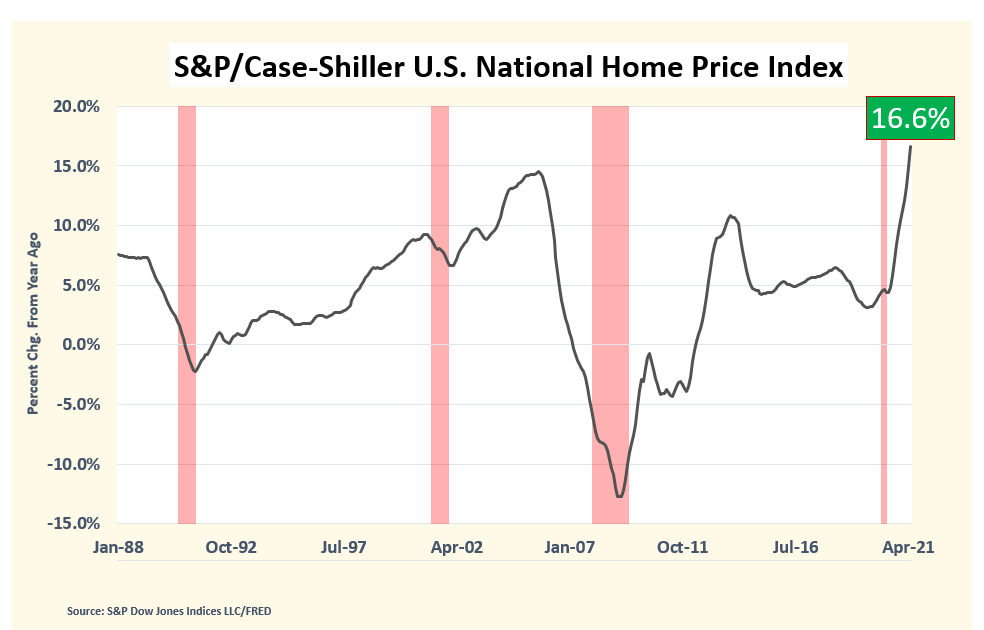
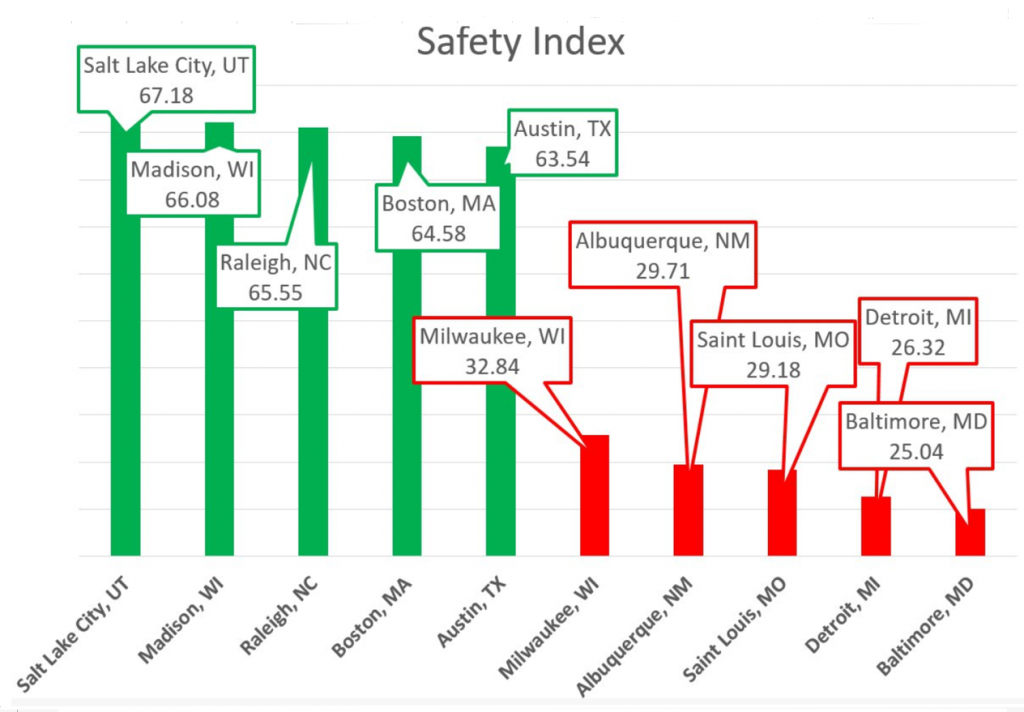
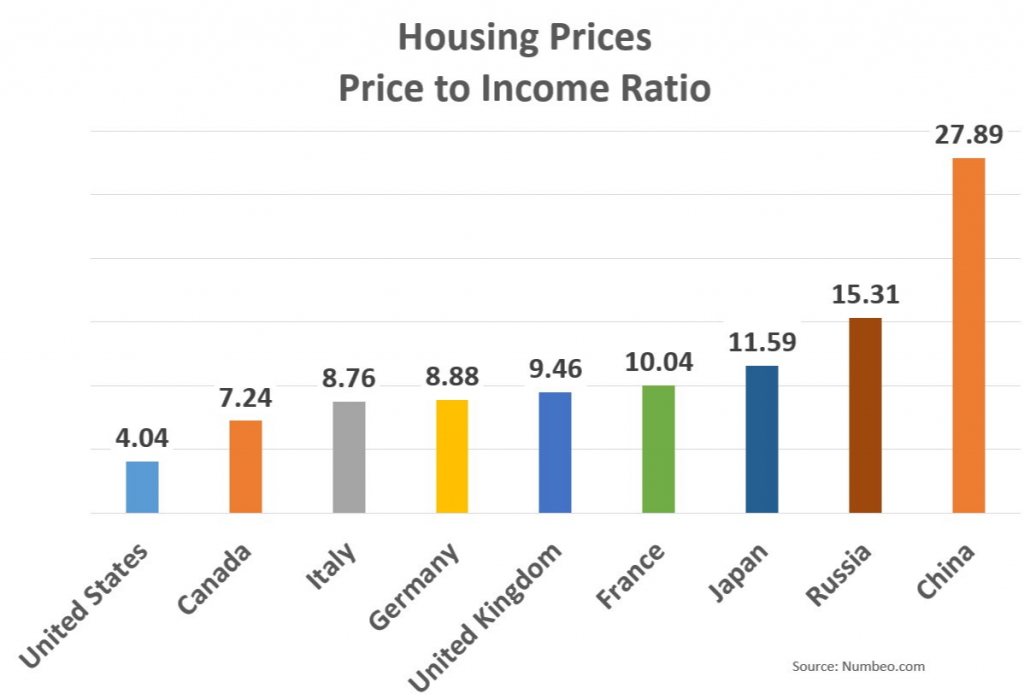
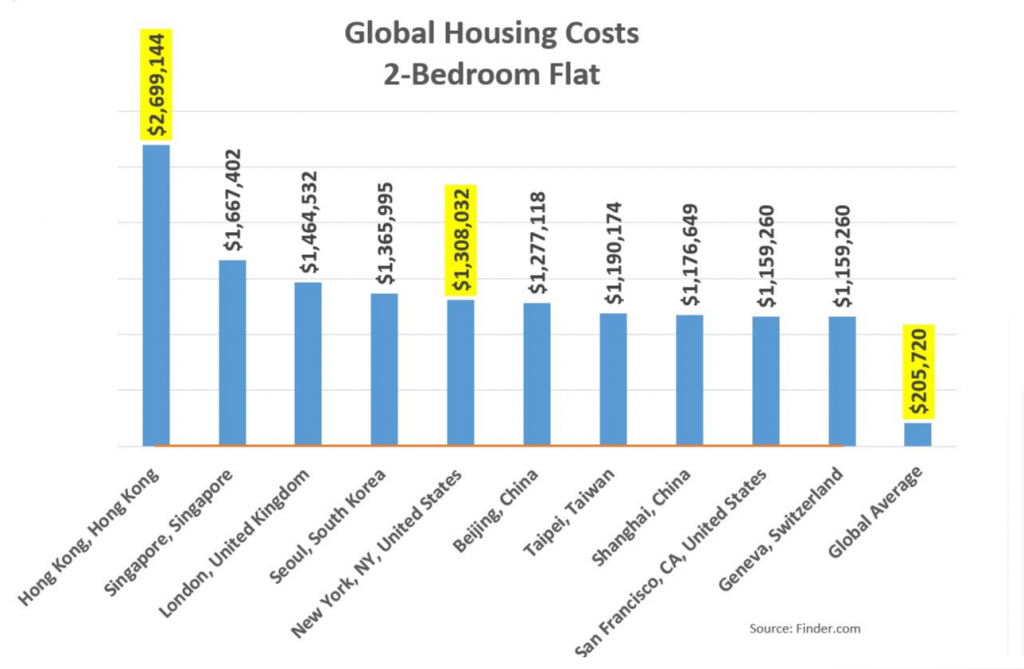
U.S. home prices continue their ascent. National housing costs increased 16.6% over the past year, as reported in today’s Case-Shiller report. So, is the cost of buying a home still in reach for most Americans? How expensive is our residential property compared to other nations globally? The follow charts convey the message that Americans, relatively speaking, are getting a pretty good deal.


Disclosures: Any views, thoughts, and opinions pertaining to the subject matter presented in this post are solely the author’s subjective opinions, and do not reflect the official policy or position of 1st Discount Brokerage, Inc. Information is for educational purposes only and does not intend to make an offer or solicitation for the sale or purchase of any specific securities, investments, or investment strategies. Investments involve risk and are not guaranteed. Past performance is no guarantee of future results. Any examples, outcomes, or assumptions expressed within this article are only hypothetical illustrations and should not be utilized in real-world analytic products as they are based only on very limited and dated open source information. Dollar-cost averaging, diversification, and rebalancing strategies do not assure a profit or protect against losses in declining markets. Asset allocation and diversification do not ensure or guarantee better performance and cannot eliminate the risk of investment losses in declining markets. Assumptions made within the analysis are not reflective of 1st Discount Brokerage, Inc. nor its personnel. 1st Discount Brokerage, Inc. is a licensed FINRA Broker-Dealer and Registered Investment Advisor. Securities offered through 1st Discount Brokerage, Inc., Member FINRA/SIPC.

